Putting Images in their Place
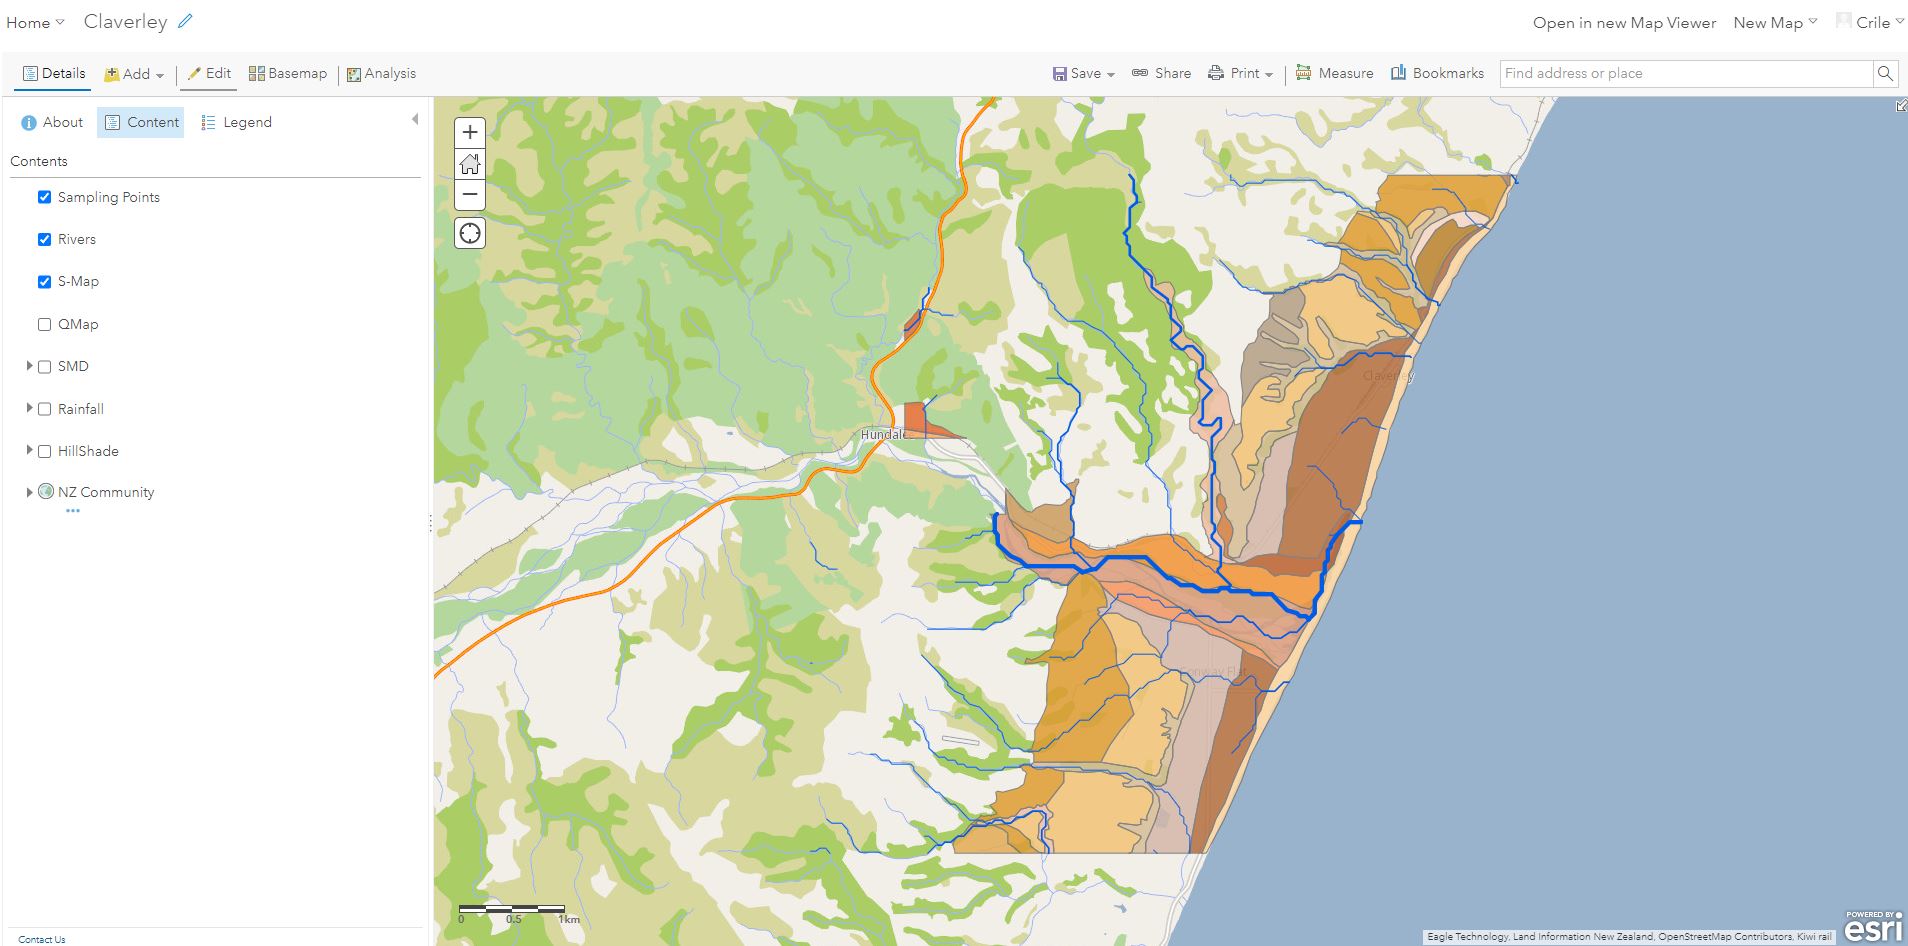
Ah, Monday morning… One message in the inbox this morning brought up a classic GIS workflow. How do I take potentially useful information in something like a PDF and add it to a map? This brings us to georeferencing and digitising. As an example of that, we’ve been working with Peter Almond to put together a webmap that his SOSC301 students can use for a field tour, one that allows them to collect data points in the field while also displaying a few key spatial layers, like soils, geology, and LiDAR elevations. Students will be out doing fun stuff like soil coring and digging soil pits and this should help them record their data for later use. Hope the weather’s good!
For this map, it would be helpful to show the paddock boundaries on this farm they’ll be visiting, which is Claverley, just at the mouth of the Conway River. What came in the mail was a PDF of a farm map with the paddocks shown in white:
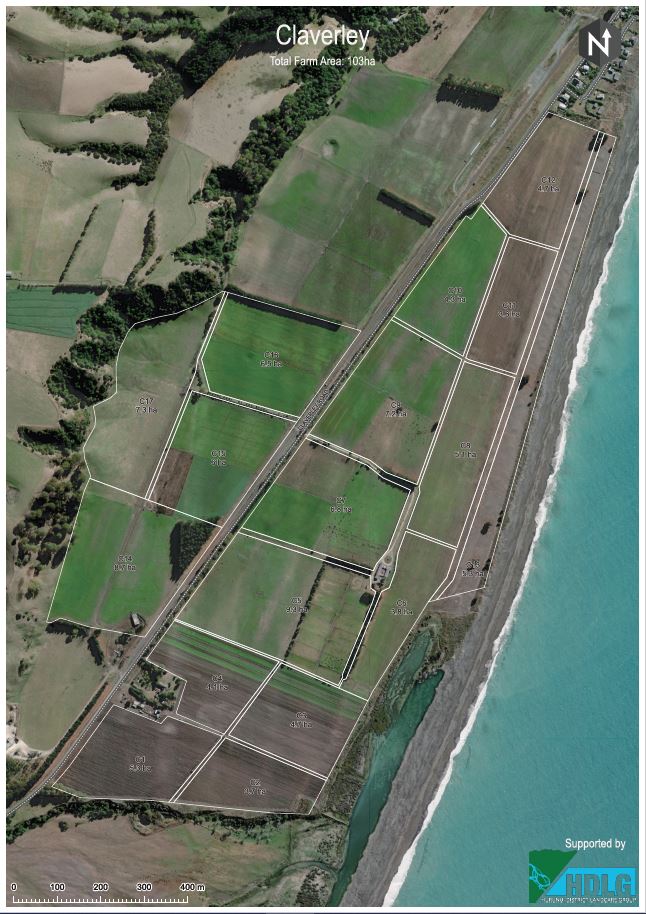
All well and good, but as far as GIS is concerned, this is just a bunch of numbers that tell the screen what colours to display. There’s no actual information that tells the software what’s a paddock boundary, or what’s bush, or a road, or water. That all happens in the wetware. To make matters worse, ArcGIS doesn’t want to know PDFs – you can’t add them to a map. And here comes the classic GIS workflow: georeferencing followed by digitising.
In its native format, an image like the one shown above doesn’t have any spatial information attached to it. More specifically, it doesn’t have any information about a coordinate system that GIS could use to put the image in its proper place. We tend to take for granted that when we open up, say, Google Maps, everything displays where it’s supposed to – and the only way that can happen is if the data know their place in the world. Georeferencing is a process we can use to sort of tell the image where it lives by adding in coordinate system information. Then, we can use the image as a basemap and create new features on top of it. Here’s a very quick overview of how this is done.
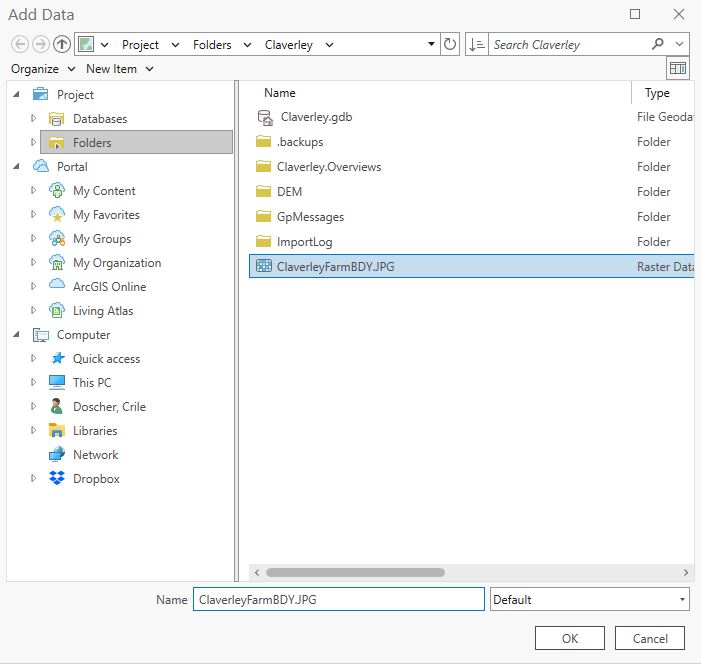
First off, I used the Snipping Tool to grab a copy of the image and saved it to as a JPG file that works within ArcGIS. Then I can add that directly to the map in the usual way:
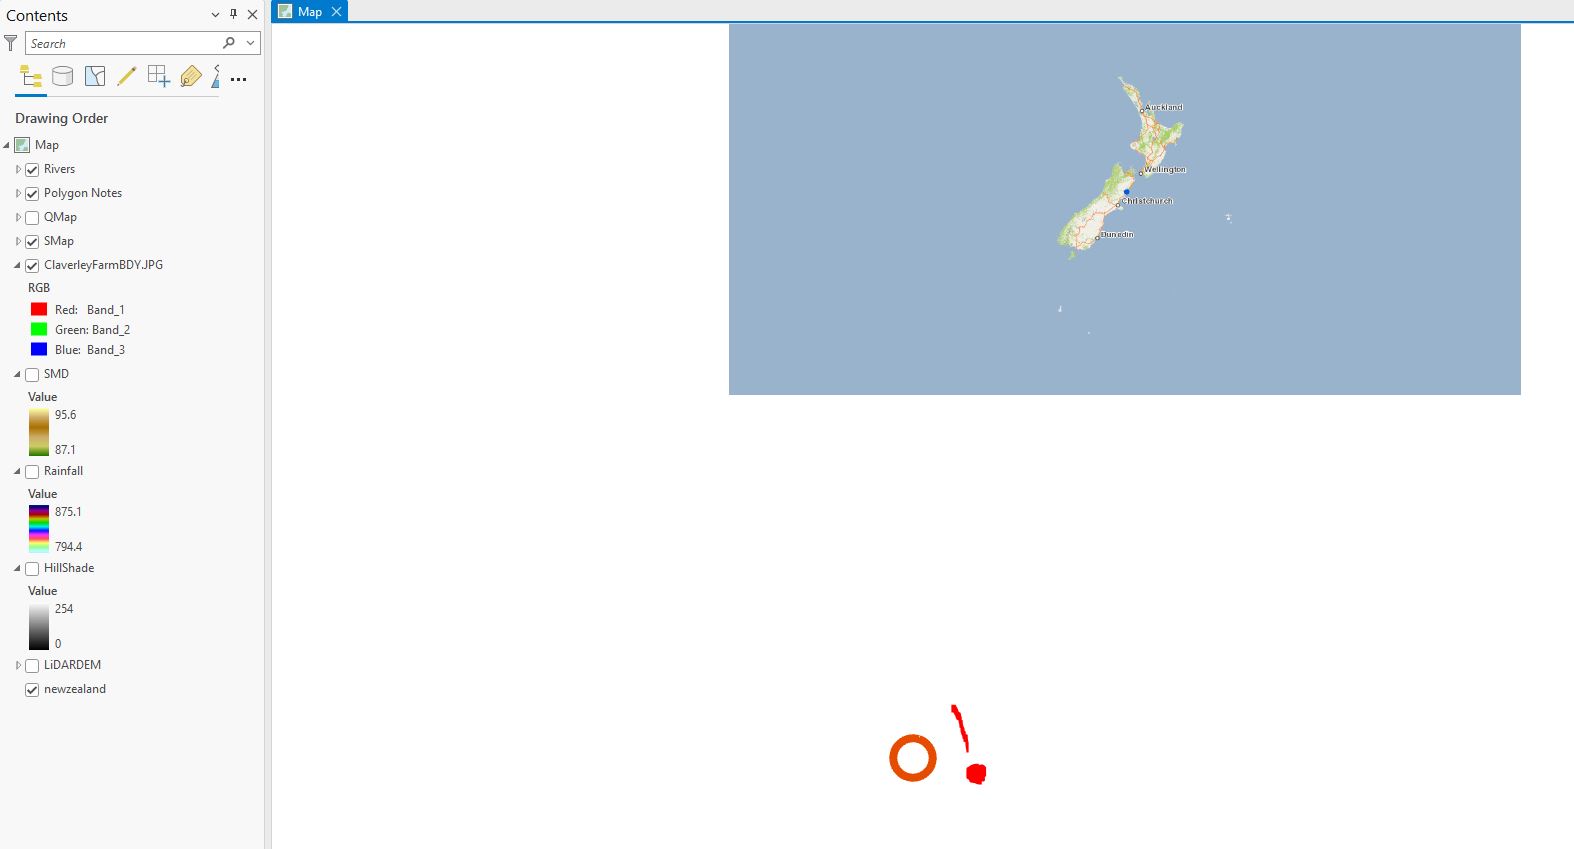
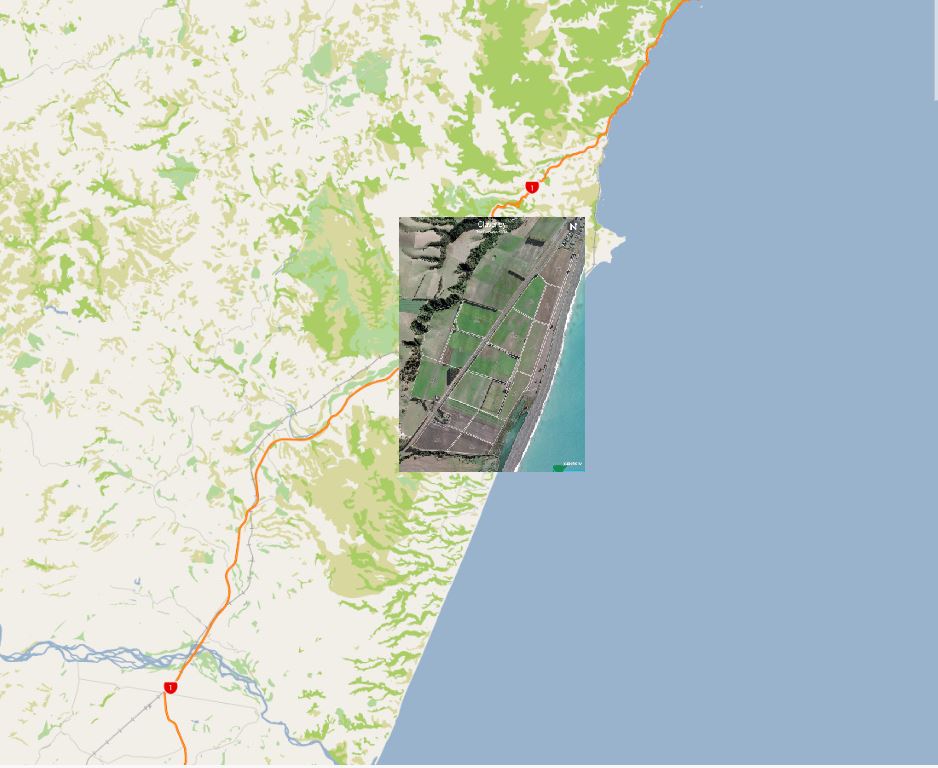
I said earlier that the image doesn’t have any coordinate system information – that was only partially true. It does, but it’s only a local one, i.e. one that only applies to the image itself – it doesn’t relate to anything in the “real” world. This local coordinate system allows the computer to know what pixel to put where. It starts in the upper left hand corner with 0,0, increases positively to the right and negatively towards the bottom. While this is now on my map, it’s nowhere close to where it’s supposed to be. My map is in the national coordinate system (New Zealand Transverse Mercator – NZTM) so the new image gets displayed where 0,0 is in NZTM, which happens to be somewhere well south in the Southern Ocean, way off by its lonesome and well off of our basemap. Must be very cold there…
With georeferencing I can set up links between things I see on the image and where those things should be within NZTM. In the process, the image shifts so that those points are as close as they can be to their actual location. In practice, this usually means picking things like road intersections or buildings, or fence lines that are easy to relate to existing spatial data. This particular one is a bit of a challenge as there’s not much to work with that’s fixed – rivers change, coastlines move, bush grows or gets cut away, so you need to find things that are pretty fixed. For this image, I’ll aim to use road related things, like intersections.
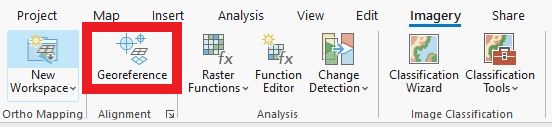
As a first step, note that since there’s an image on my map, I’ve got a new tool on the Imagery tab – Georeferencing:
Clicking that opens up a new tab:

On the far left is the “Fit to Display” option, which does a very rough job of putting the image into the same space as the current map view.
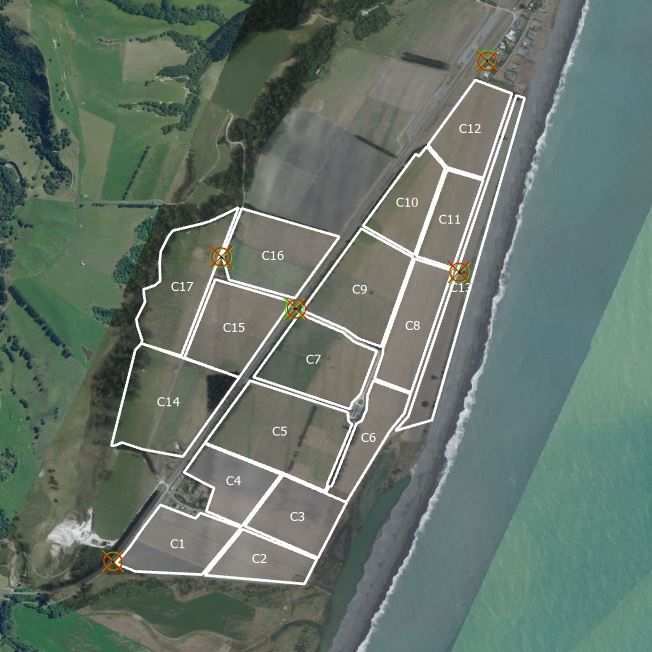
You can see it’s not a great fit, but now I can use “Add Control Points”  to set up connections between what I see on the image and where those should be. As I create the links (image first, data second), the image shifts its position to best fit those links. Sometimes that means really shifting the image, but that depends on how much distortion there is in the image. This one is reaonably straightforward and I only need a few click to get it pretty well sitting pretty:
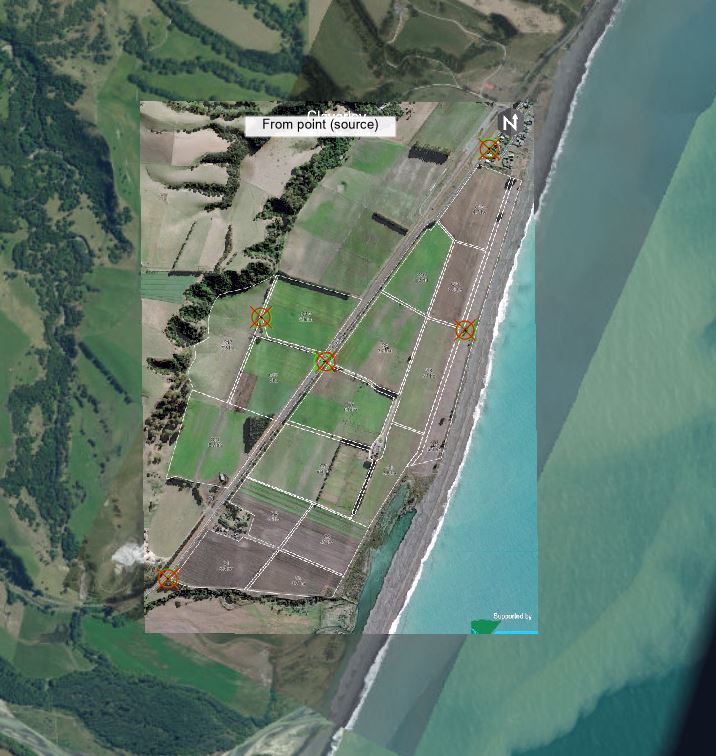
You can see that the process has slightly changed the shape – it’s no longer quite a perfect rectangle – that’s down to distortion, but it’s a reasonable fit. You can also see the points I used – they match well (at this scale). I could now export this image to a new file with the coordinate system embedded, but for now I’ll just leave it as it is.
That’s the first half of this workflow. The second is using this georeferenced image as a basemap to create new spatial features on top of. I’ll first create a new polygon feature class to hold these features and then use the editing tools to create new features. I’ve added a field called “Paddock” to the new feature class and add the paddock names I can see from the map image as I go. The main editing tool I’ll use is the Polygon tool as they all seem to stand alone.
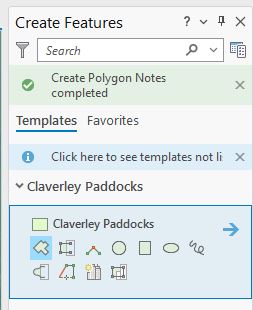
To get things started, find Create Features on the Edit toolbar – the pane opens to the right and my new feature class is there with the different tools for creating new features is available:
I’ll use the Polygon tool to create my first paddock, using the outlines on the georeferenced image as a guide:
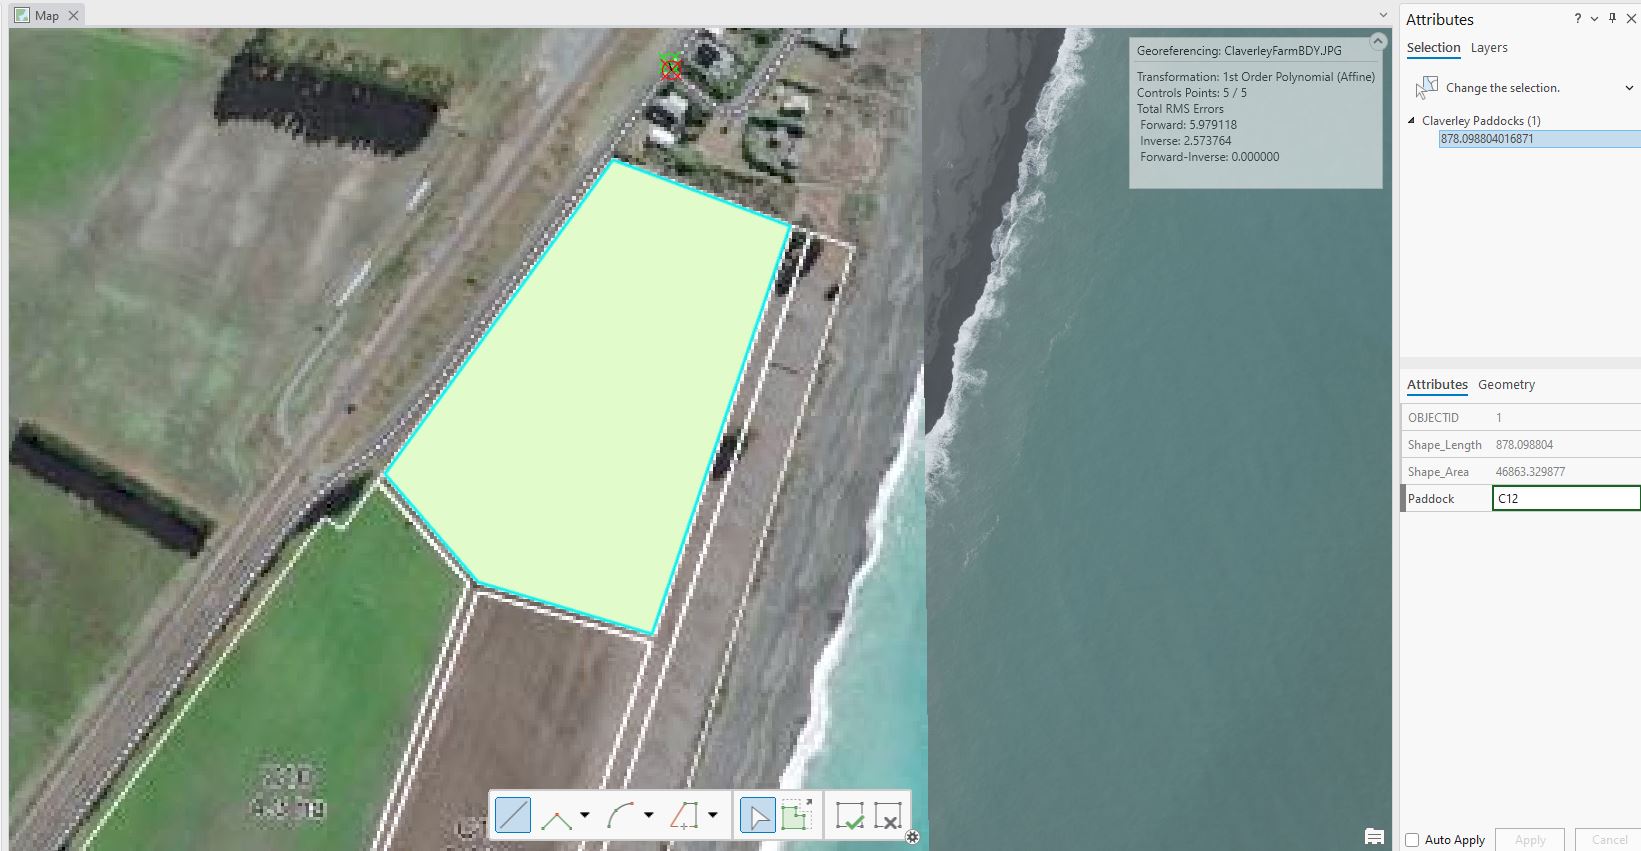
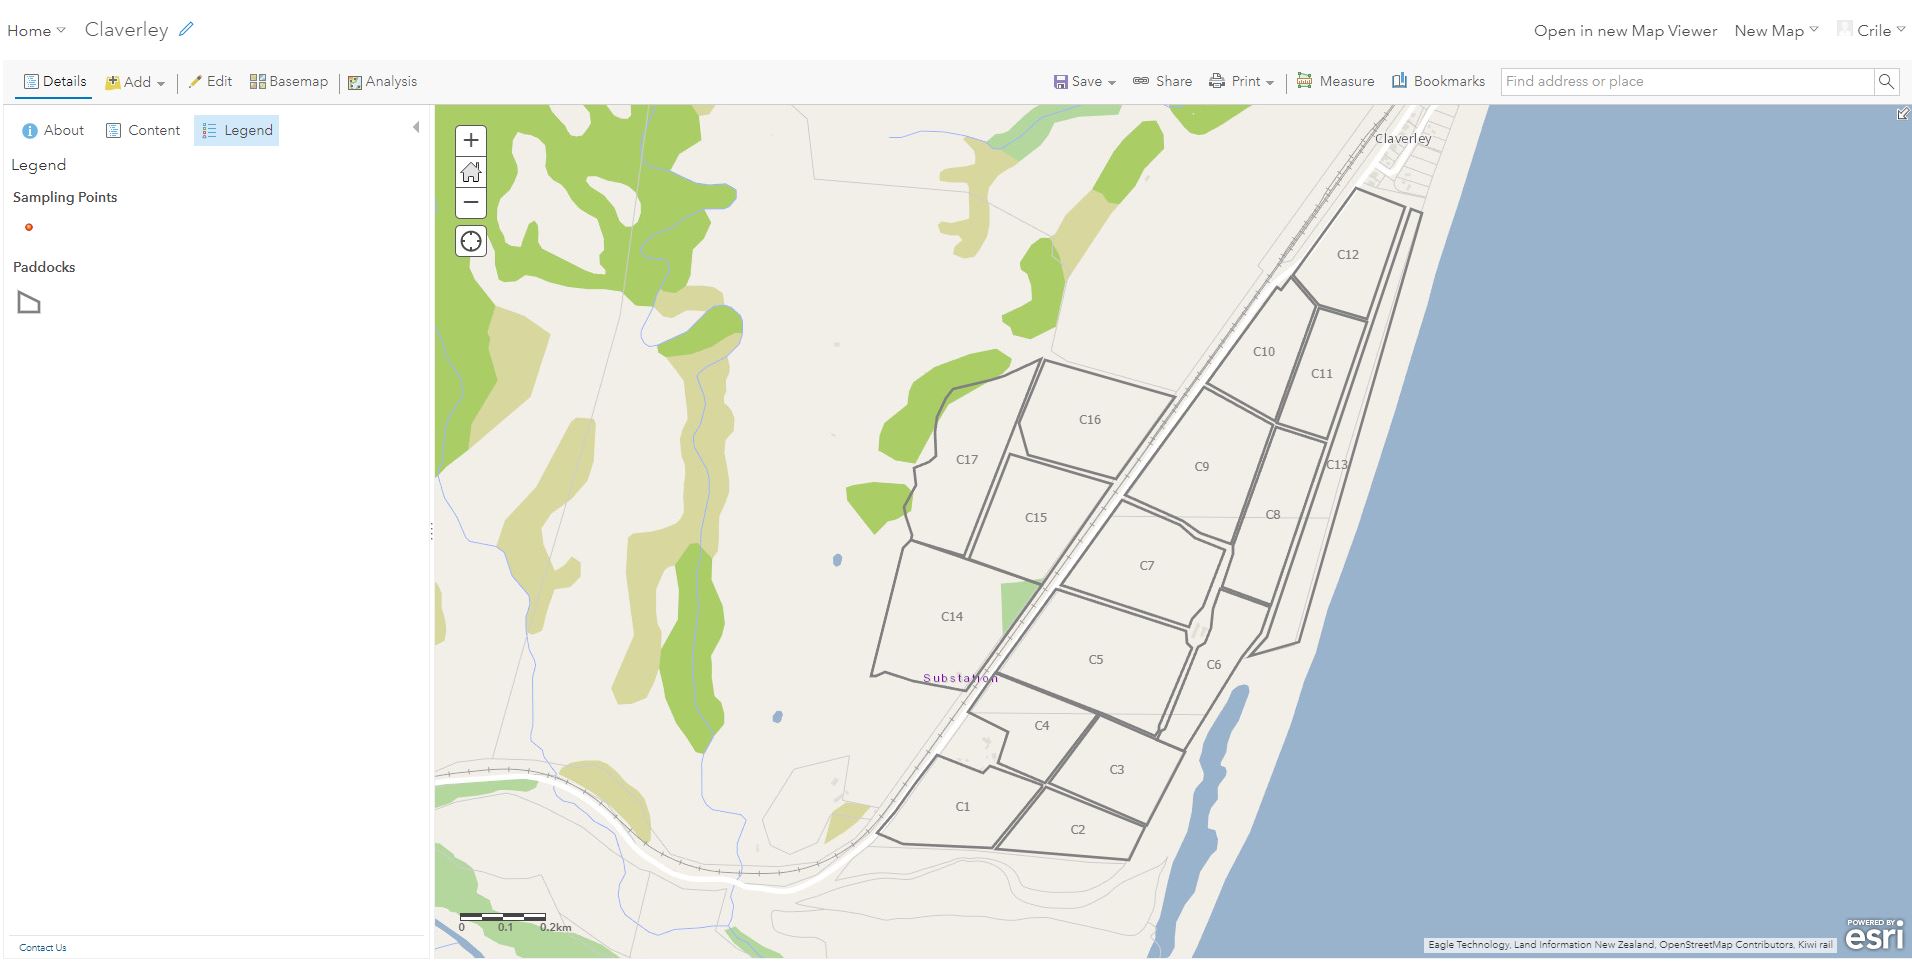
Then it’s just down to the donkey work of creating new features until I get them all (shown with similar symbology to the PDF):
Total time for this digitising? About 15 minutes (it’s not perfect…) and let’s say half an hour all up with the georeferencing side of things added in. Now I can add this layer to the webmap and students will be able to see this out in the field.
Georeferencing is an incredibly useful technique for taking non-spatial data, like PDFs, old maps that have been scanned, aerial photos/satellite images, and give them the spatial data they need to fold into our existing layers. This ranks amongst the top 5 most useful techniques in my book.
C