That Cat(fish) Scratched Back
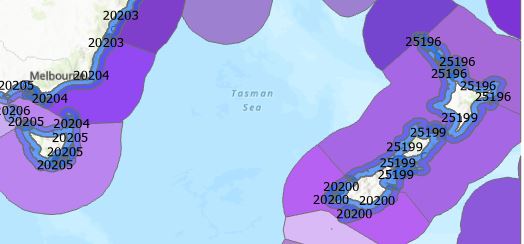
We look at extending our marine ecoregion polygons to get more observations categorised – not as straightforward as it might sound. In a previous post we looked at extracting data on marine ecoregions to a set of observations points. For the most part it worked pretty well, but out of our 2million+ points, around 200,000 […]

The Cat(fish)’s MEOW
We look at mapping observations of different marine species globally. It’s been said that we know more about the surface of the moon than we do about our own Earth-bound oceans. I suspect that’s true. The amount of data available once we step off the land and into the briny is quite limited compared to […]

Carnival of Coordinates
We struggle with a point dataset’s coordinate system and delve into UTM. Ah, if only every day could be a carnival at GIS Central…sigh. Rather than a samba to start the day, here’s a fairly common occurrence: a colleague sends me some data in a CSV file and asks me to map them. As usual, […]

Only Connect
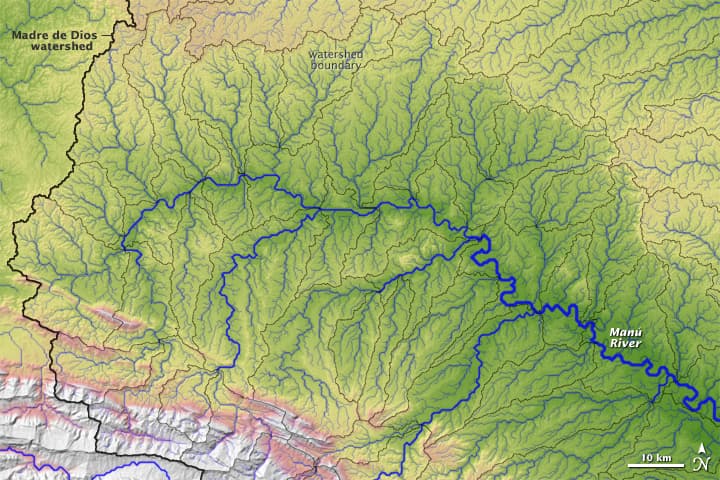
We use network analysis to find streamflow gauging stations downstream of phosphorus sampling points In his novel Howards End, E.M. Forster encouraged us to “only connect”. He was talking about connecting the prose and the passion in our lives, to the exaltation of both, but here we’ll talk about connecting sampling sites within a river […]

Nearer my Points to Thee
We use the Near tool to link streamflow gauging stations close to phosphorus sampling points. In a previous post we looked mapping some water quality sampling points using the visual hierarchy. We’ll continue looking at a few aspects of this project over the next few posts and hopefully see some interesting and fun stuff along […]
Points with Purpose
We look at different strategies of mapping global points using definition queries and the visual hierarchy. Postgrad Jordan had an interesting and relatively common mapping challenge so in this post we’ll look at some of the options we tried to get a final and effective map for his research. He’s looking at the effect of […]

The Scale’s The Thing
We look at turning layers on and off at chosen scales to make for a better map. Alas, poor Yorick! I knew him, Horatio: A fellow of infinite jest. With all due respect to Hamlet and Willie the Shake, this time we’ll look at an oft underappreciated side of mapping: scale dependency for layer visibility. […]
Think Globaly, Extract Locally
We use Zonal Statistics as Table to extract raster data to polygons…but not without some frustration. In our last instalment we covered extracting global data to a set of 15,831 points. I’ll show those points again below to jog our collective memories. As we saw, it’s proved a challenge in many ways that could occupy […]

The Point(s) of the Data
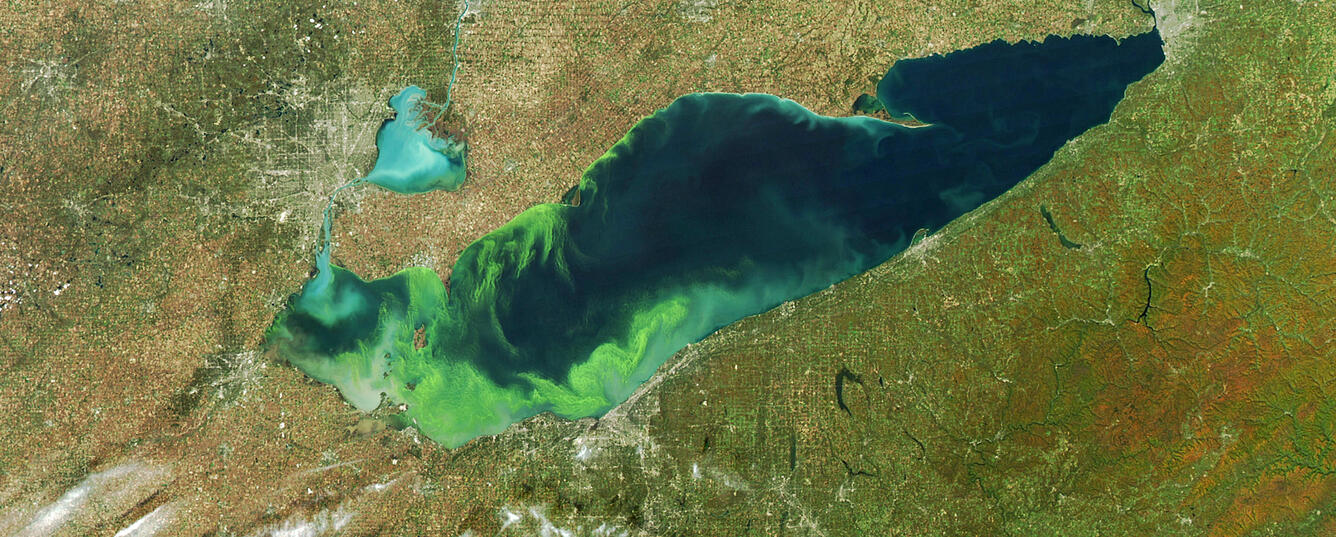
We extract values from a range of global datasets to points for some E. coli analysis. Ah, Paris! The beautiful Seine! As the Olympics slowly fade from memory, some may recall that our triathletes were exposed to E. coli in the Seine River and experienced some unpleasant and performance diminishing gastrointestinal distress. I, too, have […]

Lessons Learnt from Muddy Boots
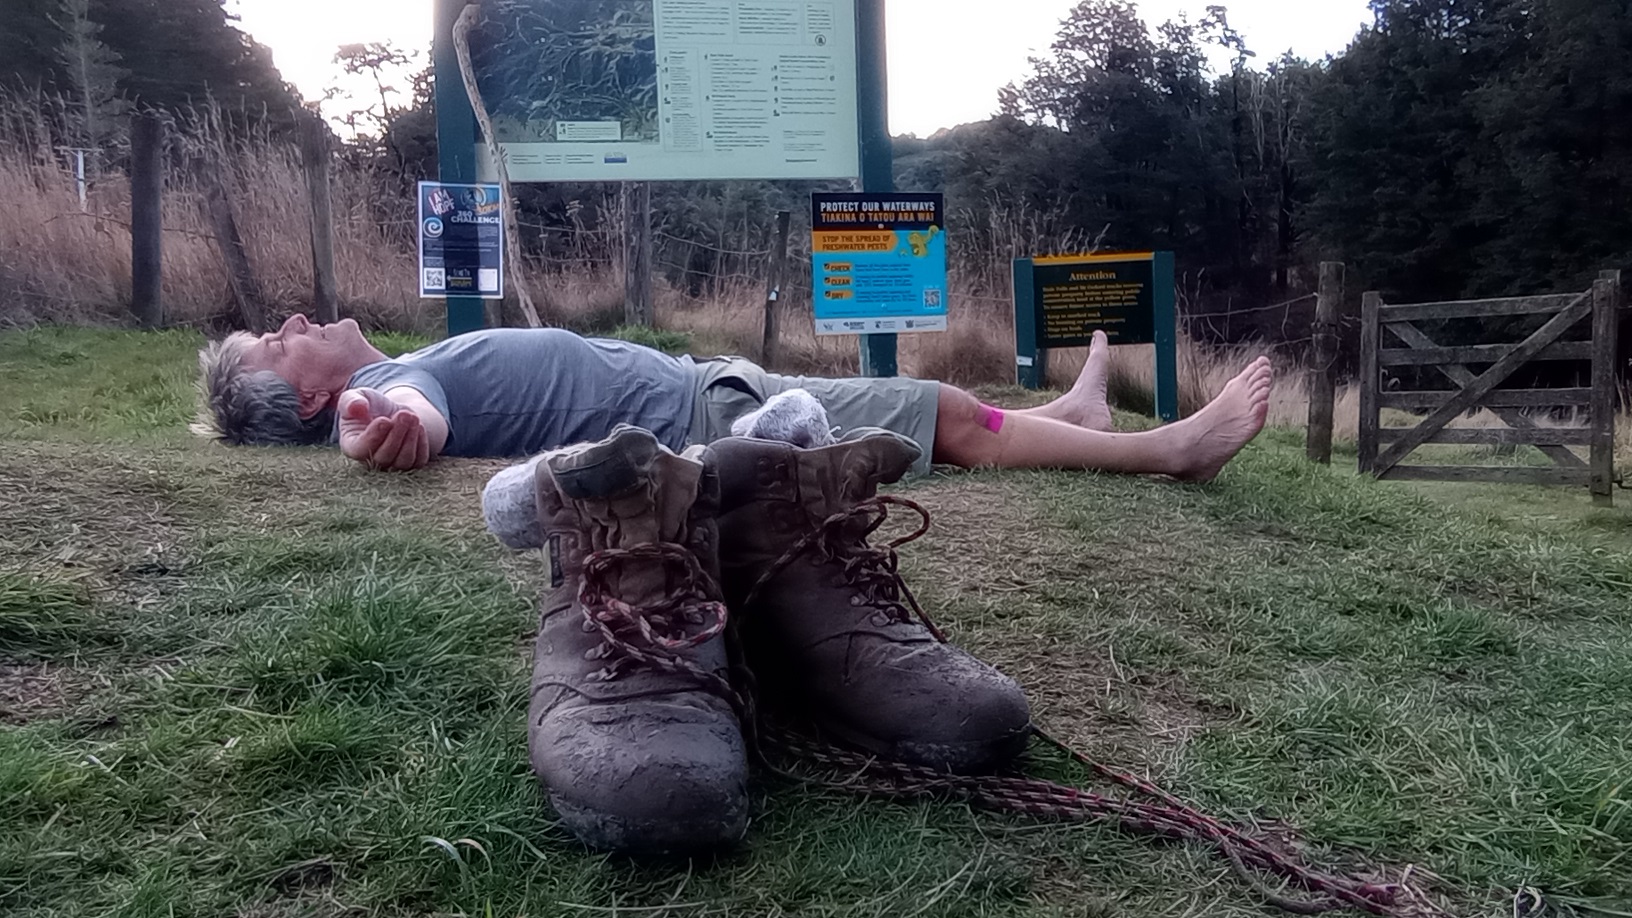
Last weekend was a glorious, bluebird weekend and I was lucky enough to head out on an early season tramp with daughter number 1 (number 1 in terms of birth order; they’re both number 1 in my book). What could possibly go wrong? Only that I’m getting to be an old man and my knees […]