GIS for the Masses!
It’s been a very busy start to the semester here at the GIS Gizmoplex. In our quest for world domination, er, no, fame and fortune, nope, okay, better integration of GIS into courses, we’ve been working on ways for students to use GIS as part of their coursework. It’s been great working with some of the ERST607 students and colleagues to make these happen. Special thanks, too, to Claire from Eagle Technology, who came through with a nice behind-the-scenes data solution. Here’s a brief overview of what’s happening.
SOCI314/ERST624
Femi is running a planning course where students need to create their own plans for future development – which lend themselves very nicely to maps. We’ve developed a web map that these students can use to do this. As you can see in the image below, they have layers available such as the current Selwyn District plan, plus landcover soils, and water features:
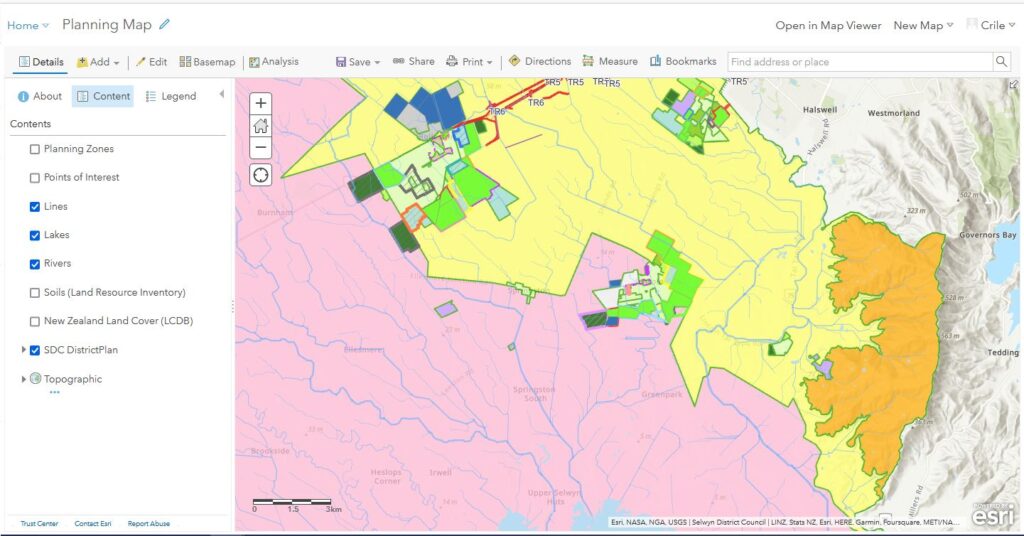
A particularly useful feature of this map is that each student can create their own data on top of the ones available. There are three editable layers: Planning Zones (polygon), Points of Interest (points) and Lines (well, er, lines). By clicking the Edit button they are able to create their own features:
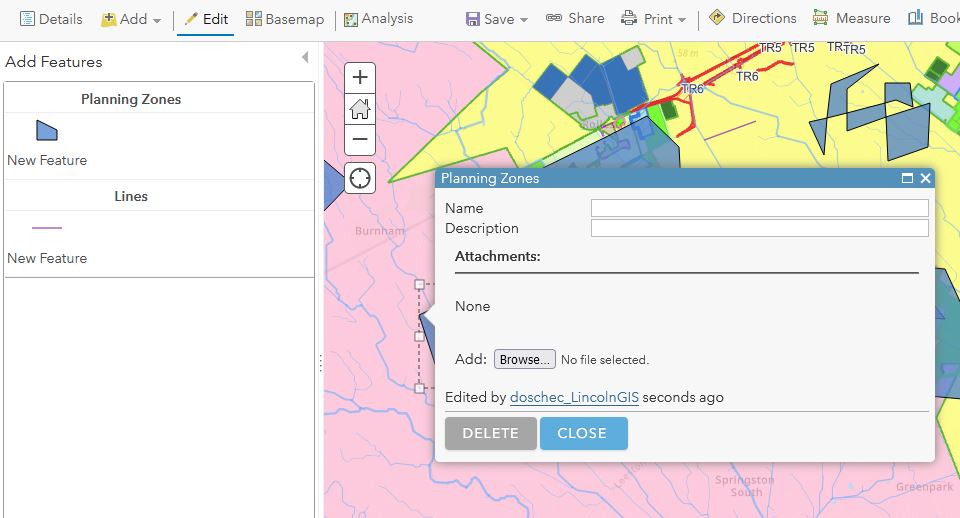
Et voila! Their own custom maps. Note that they can add their own attributes into either the Name or Description fields and use those values later for different symbology on the map.
LASC312/DESN698
For Wendy’s Landscape Ecology course, we’ve developed a similar web map that students can use to develop their own ecological guild restoration plans:
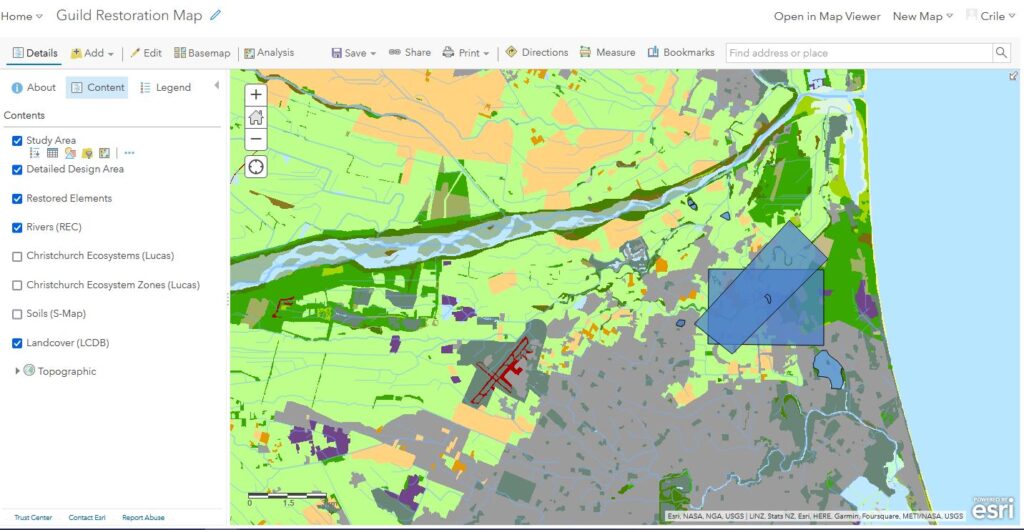
Some similar layers available here – landcover, soils, plus some predefined ecosystems for the Christchurch area. There are three editable layers on this one: Study Area (polygon) to define a large study area, Detailed Design Area (polygon) for a more focused design area, and Restored Elements (areas to be replanted). Students will be able to use this to understand how much guild-supporting landcover is in with their study areas and then add their own suggested planting areas. So far so good!
SOSC301
We’ve had an ongoing collaboration with Peter Almond’s SOSC301 course, where over the mid-semester break, he takes them off to far flung places where they dig soil pits and do some augering to develop their own soil map (we aluded to some of this work previously). Students can use this map on their phones in the field (literally) to collect the data from their field work to our servers (I’m told they’ll have a good internet connection there using Starlink…flash!). Later on, they can work with these data to develop their own maps. They can also take pictures and attach them to their new data points. By using this web map (a web app, really), their data are stored safely and can be accessed at any time later. This approach has worked well over the past several years across the Canterbury Plains.
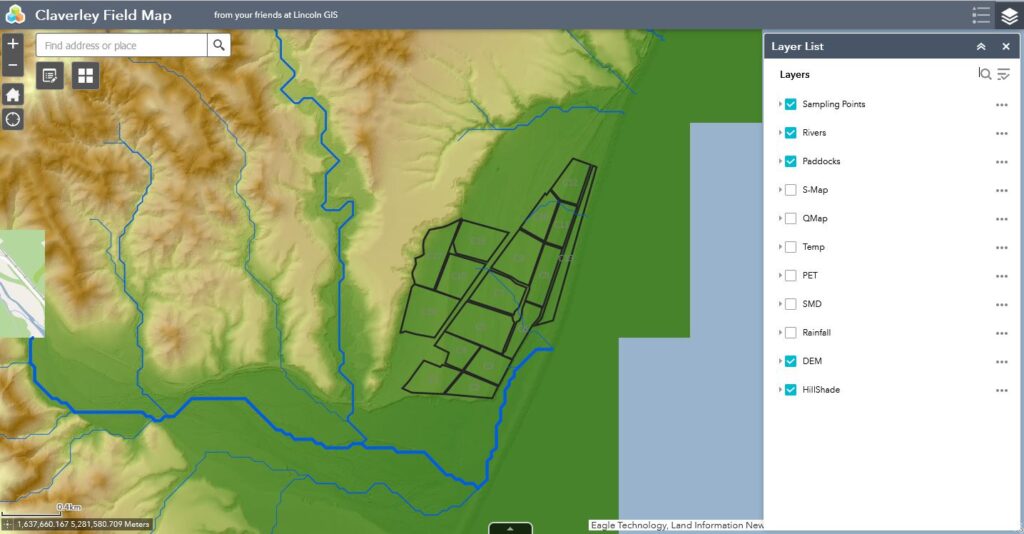
Sampling Points is the editable layer on this map, in addition to soils, geology, elevation and a range of climatic layers.
The nice thing about all these is that they get students using GIS without them having to know all the gory details of data formats, and geodatabases, and tool after tool after tool. It’s been a bit more extra work than I had hoped, but in the end, that rising GIS tide will hopefully float more spatial boats.
C