A Label Conscious Map
Label classes give us a bit more control over how features can be labelled on maps.
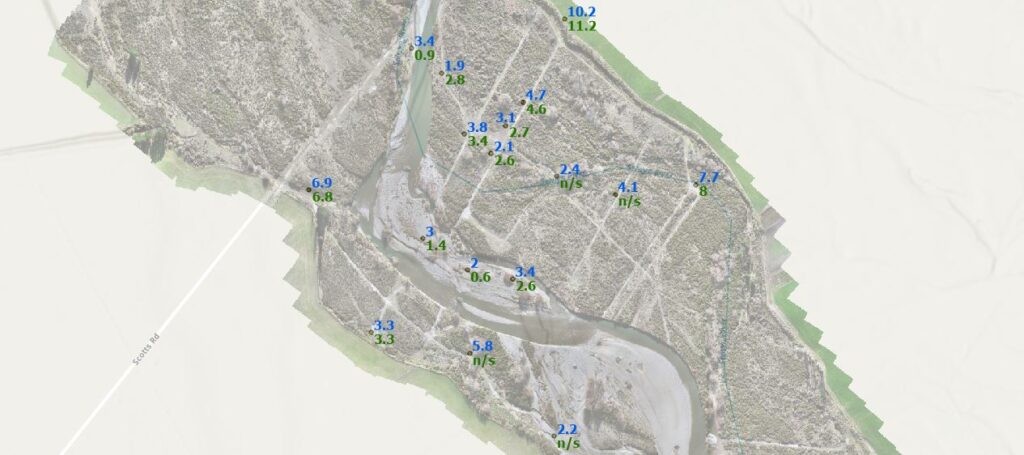
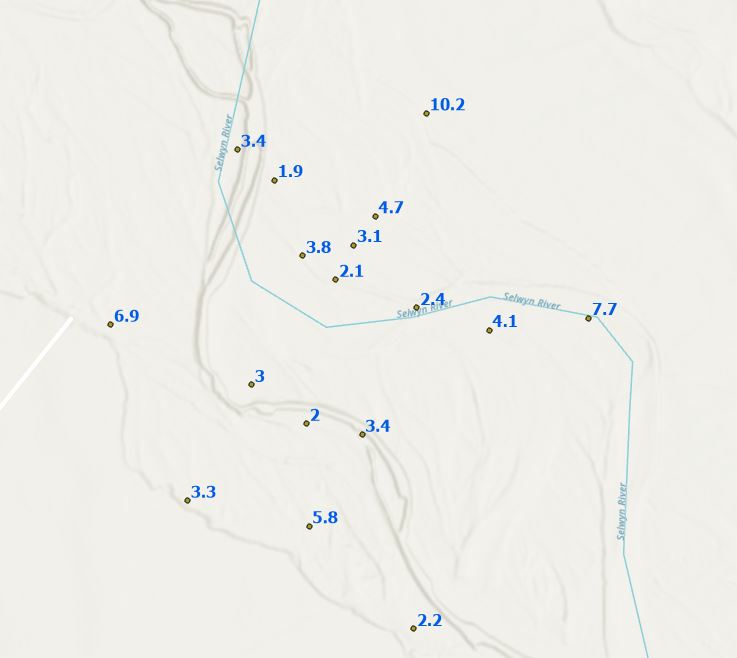
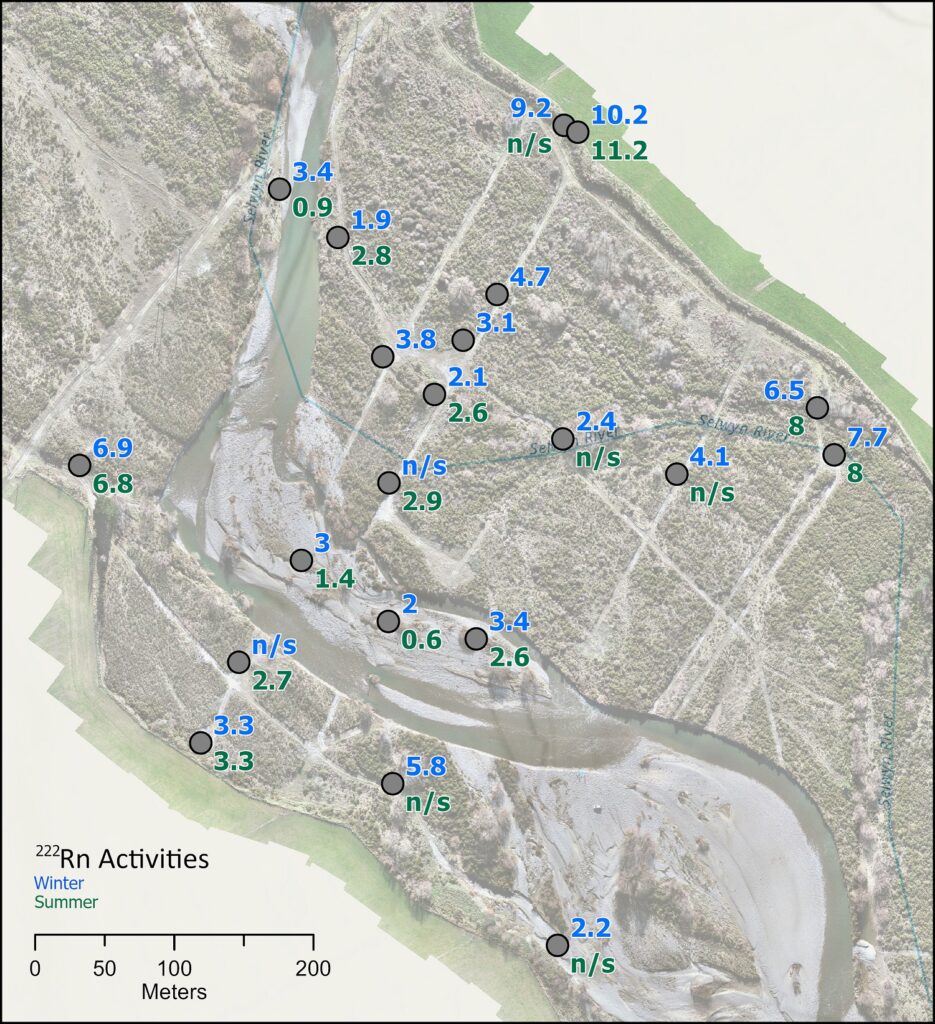
We’ve been putting some figures together for a paper coming out of Christy Songola’s master’s thesis. He was looking at using Radon measurements from wells in a braided river plain to determine travel times of groundwater in different seasons. Lots of field work here and some really interesting stuff coming out of this reach of the Selwyn River. As part of his research, Christy compared differences between levels of radon in winter and summer and tied those to groundwater flow velocities. For the paper, we needed a figure that showed well locations and gave an indication of what the average radon levels were – the figure above is a rough draft.
The labelling posed a few challenges so in this post I’ll look at a few different ways to do this, and we’ll focus in particular on using label classes. This takes us into the cartography side of GIS, a critical part in my mind, because if you can’t effectively communicate the results of your analysis, what’s the point?
So lets start with the data. I’ve got a point layer of wells to work with and a spreadsheet of the winter and summer radon values.
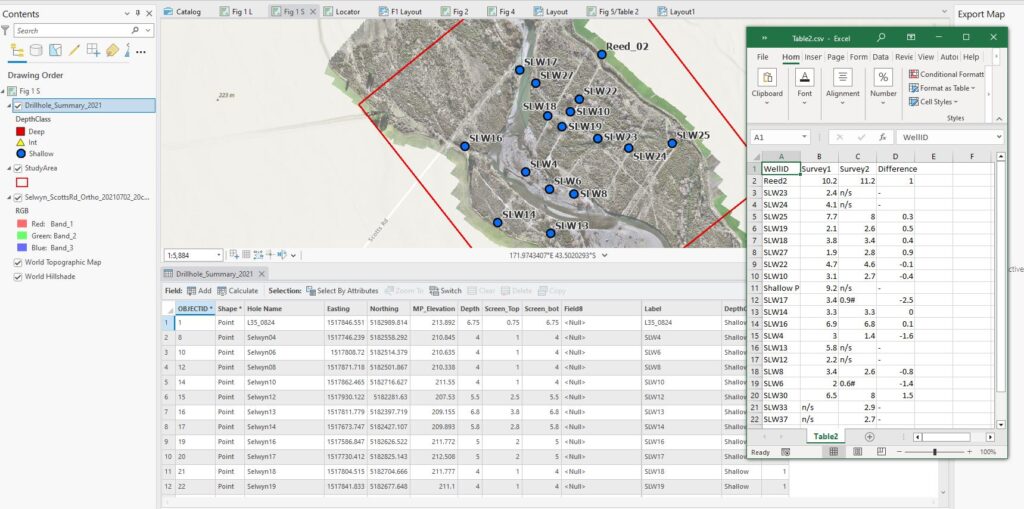
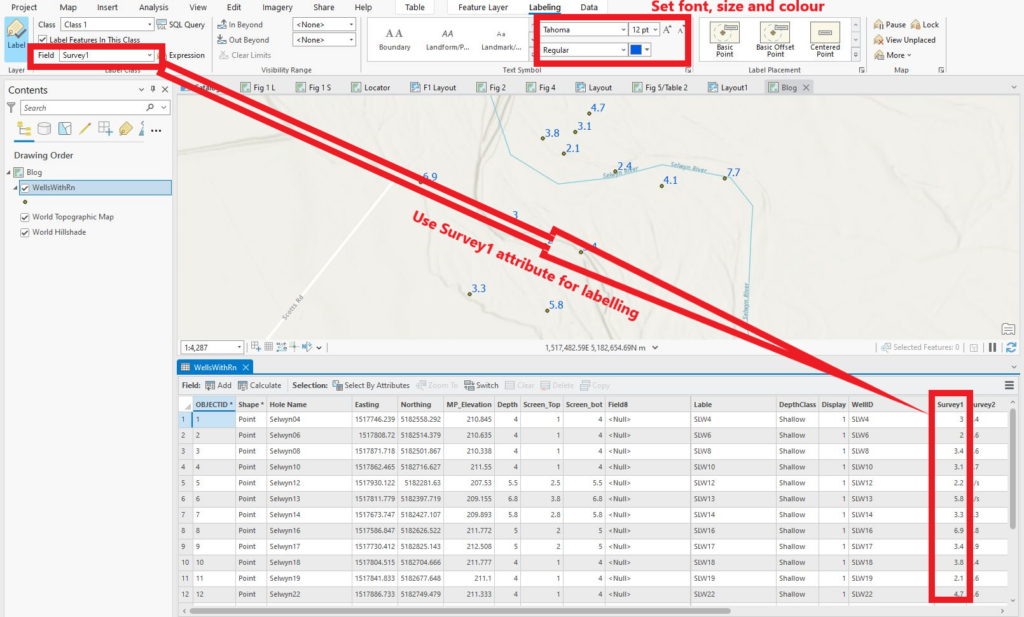
A quick table join brings the radon measurements into my spatial layer – I can now use these values for labelling and symbology. One of the key problems here is that the standard labelling methods only allow me to label one attribute at a time, not both. Easy enough to do – with the layer selected in Contents, I can go to the Labelling tab and pick one of those attributes, while also choosing fonts and colours:
But again, only one at a time. If I want to get fancy, I can use a Python expression to display both measurements. I need to write a short bit of code to do this, nothing too fancy schmancy:
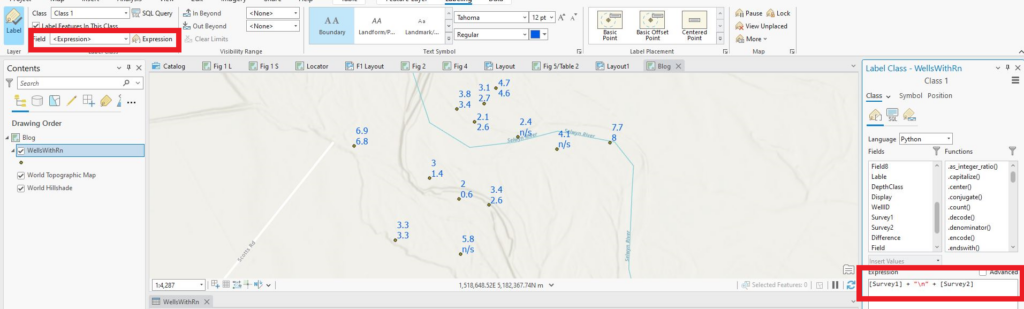
The expression “[Survey1] + “\n” + [Survey2]” means use the value of Survey 1 for each feature as a label, then start a new line and use the value of Survey2 for a second label.
This allows me to show both measurements but the limitation is that I can only use the same colour/font/size for both (unless I can find a way to do it with Python – I didn’t, but that doesn’t mean it can’t be done), so gotta try something else.
A quick and dirty way to do it could be to have two copies of the same layer on the map (nothing would prevent you from doing this) and then symbolising each one differently. This could work, but I wanted to try using label classes (Ed. you rash, impetuous soul!). According to our ESRI overlords:
“You can use label classes to restrict labels to certain features or to specify label fields, symbols, scale ranges, label priorities, and sets of label placement options for groups of labels. For example, for a roads layer, you can use a different text size to label road types based on a field classifying roads by importance. You can also create a query to label only cities with a population greater than 1 million.”
Sounds like they might work here – the benefit being I need have only one copy of that layer on the map (okay, that’s not earth shattering, I know, but it is a benefit).
In that same area of the Labelling tab, look for the Class line – there’s already one called “Class 1”
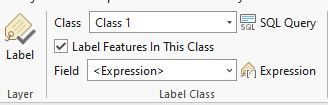
I’ll go ahead and use this to label the Survey1 (winter) values using a blue bold face font with a size of 12:
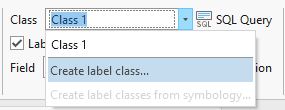
By default, they go at the upper right of each feature. Next I’ll create a new label class for the survey 2 values (from the dropdown arrow of the Class window):
And set this to use the Survey2 value with a bold face dark green colour:
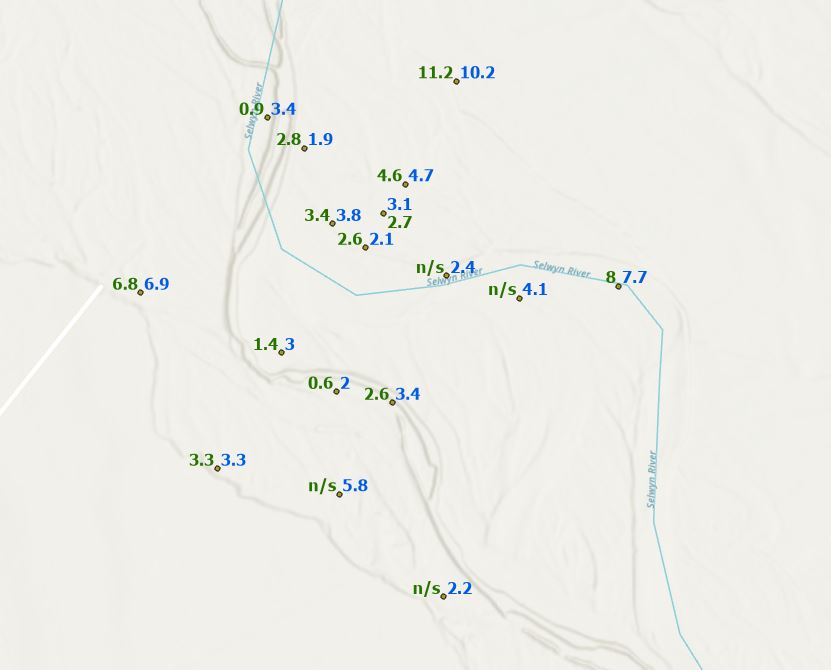
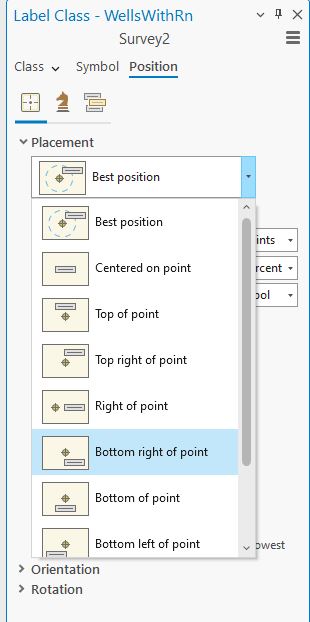
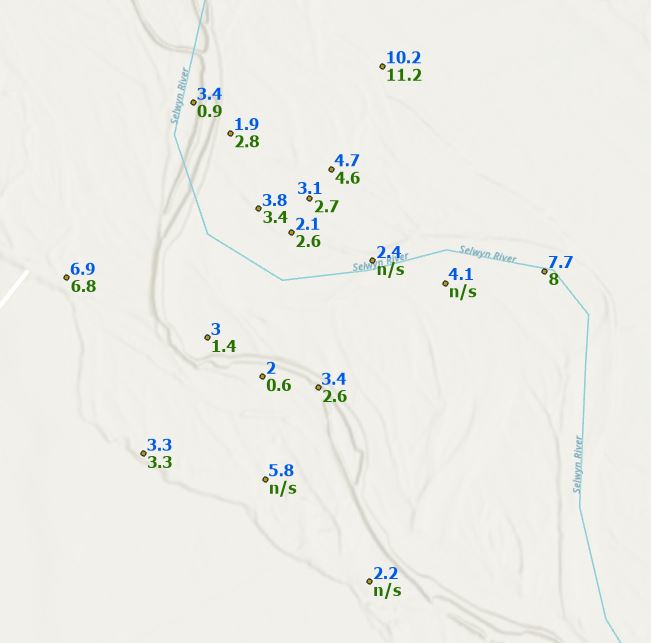
A win in that I now have both labels shown in different colours. Not so keen on them being side by side though; I think I’d rather have them stacked, so with the survey 2 label class active, I’ll go into the Position > Placement property and set it to below and to the right of the point:
Which gives me:
When I add in the satellite image of the Selwyn, this figure is pretty much done. If I wanted to I could add some text in to show which is summer and which is winter by adding “Winter: ” or “Summer: ” to the expression – that would be a bit redundant and take up a lot of real estate so I think I’ll just add a legend to the figure or point it out in the caption. With a bit more tweaking (including using a bit of a halo round the labels), here’s a more finished draft:
I wouldn’t have expected to spend this much time getting the labels right, but this image ends up in a paper that will be submitted to an international journal, so it needs to be right. And being conscious of label classes was one good way to do just that.
C