Submitted for Your Reference
Setting the reference scale for you maps can make symbology more consistent across scales.
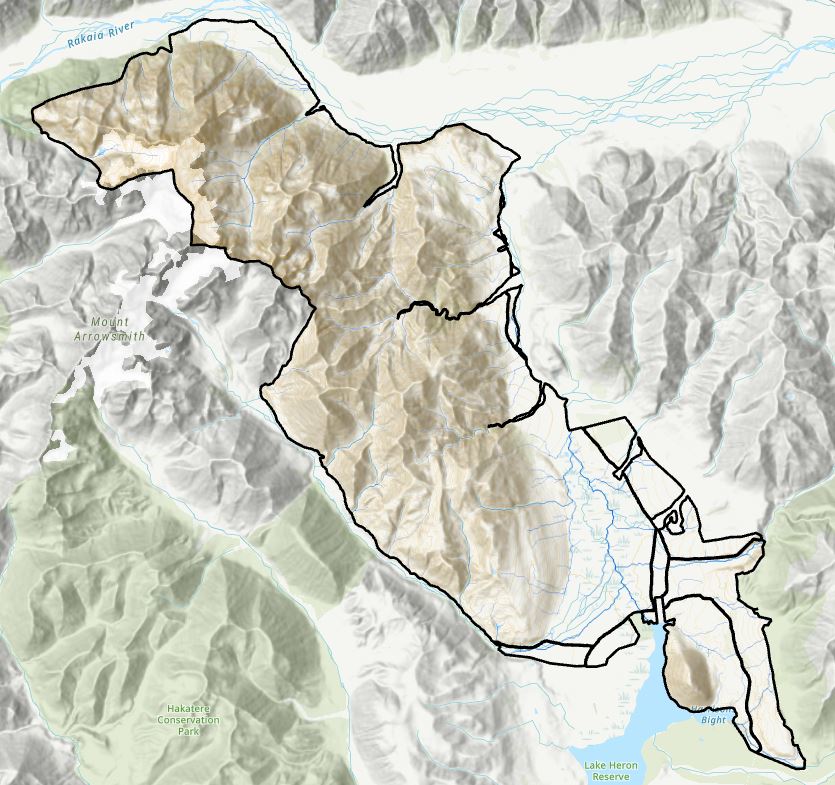
Here at GIS Central we’ve been gearing up for some work on Lake Heron Station in near Mt Somers:

As a start I thought I would pull together some of the already available data for this project, things like the LCDB, elevation, hillshades, stream networks, etc. Amongst the things I thought might be useful were the elevation contours, so using a provided layer of the station boundary, I started by clipping out the 20 m contours from J:\Data\Contours\SouthIslandContours20m.shp. Next, I wanted to put a bit of effort into labelling the contours to match how they are shown on the 1:50,000 scale topomaps – we did this once before to show how to perfect the labels using masking and annotations. With about 20 minutes worth of work I was pretty happy with my results:
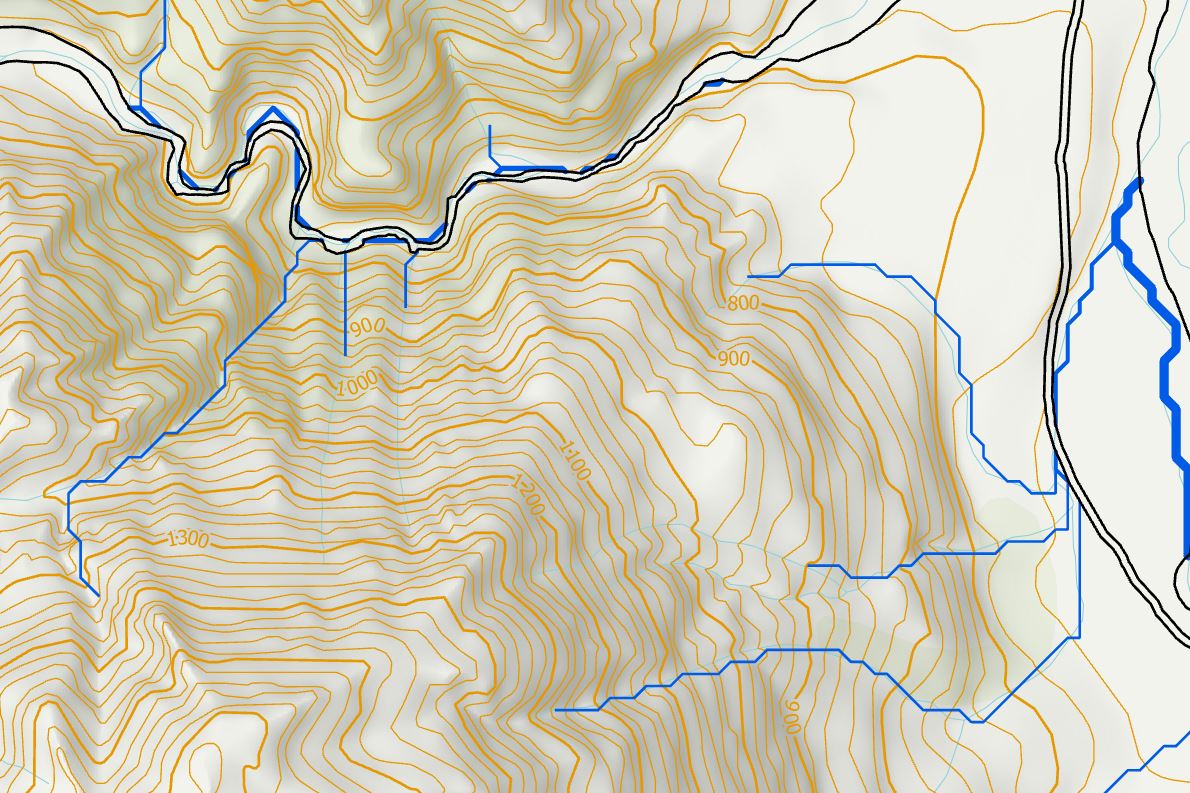
(Also used that trick of Graduated Symbols with rivers layer stream orders.) So far so good – until I zoomed out to the full extent of the station:
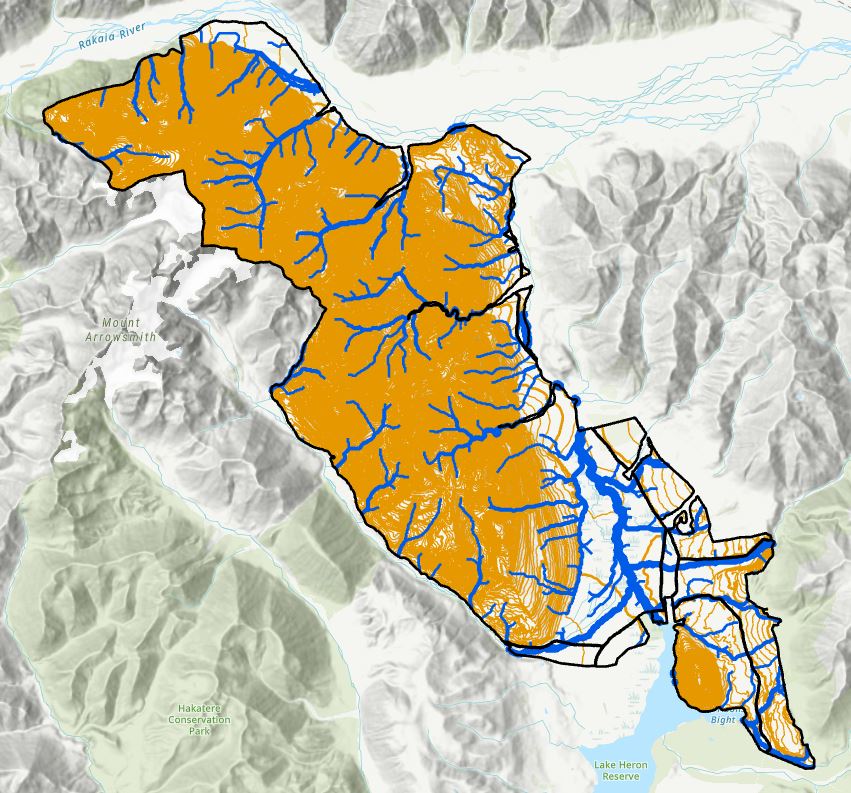
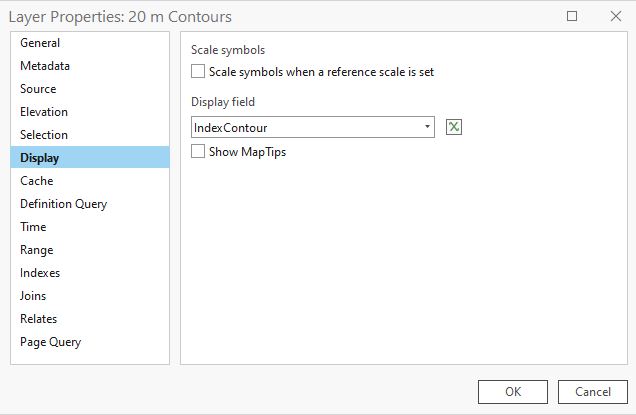
What looked nice at 1:10,000 is now overwhelmed by my contours and rivers at 1:100,000. The problem here is that when I set the thickness for my lines, it draws them at that same thickness regardless of the scale, with the effect we see above. In the deep, dark recesses of my mind, a solution sort of presented itself. I stumbled on to this when looking at my contour layer’s properties, more specifically on the Display tab:
I’ve often seen this thing about reference scales but to be honest, have never known what it’s all about, but it did get me thinking. After a bit of digging, I realised that one can set a reference scale for a map which forces the symbol size at be fixed to that particular scale. Then when you zoom in or out, the size changes to fit. For my purposes, 1:10,000 seemed about right, so from the Map Properties > General, this was set at 1:10,000 (you might want a different scale for your map – it could be a custom scale or one of the preset options):
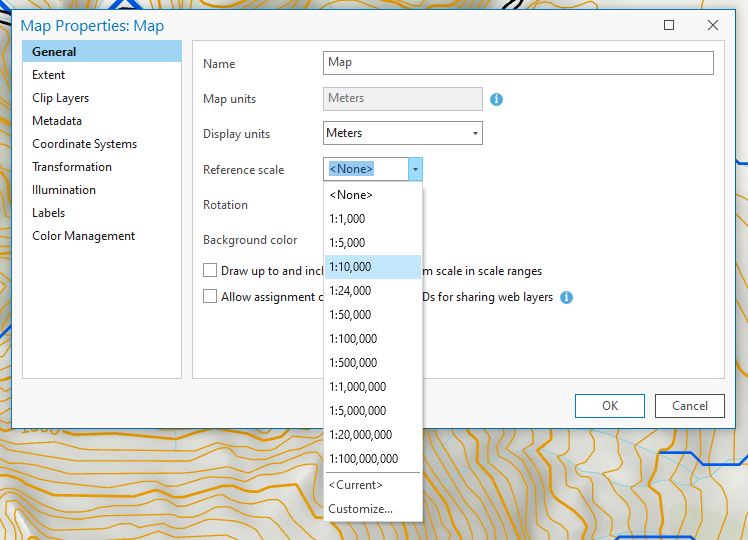
(Keep in mind – this is for the map, not the individual layers.) Now I can go back to each layer and set it to honour the reference scale once it’s been set:
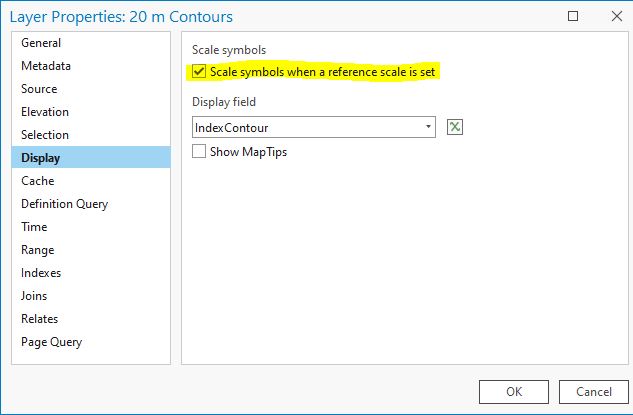
After ticking this for my contours and rivers layer, I get a much better effect:
My contours and rivers are still there, but their thickness now changes as the map scale changes. Compared to the station map above, I think this displays much better. I’ve always wondered what the reference scales stuff was all about, and now I know. There’s always something new to learn with GIS.
C